
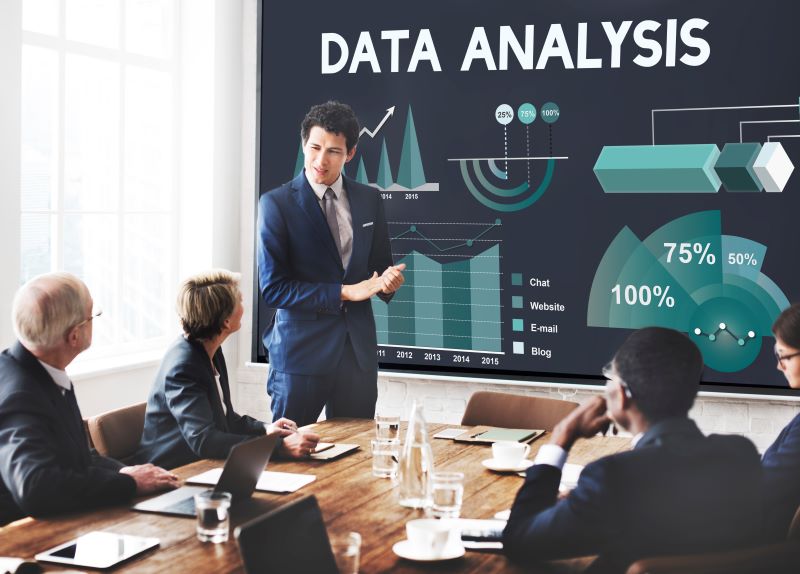
In a world overwhelmed by data, how we make sense of information matters more than ever. Data visualization, the art and science of turning complex data into understandable visuals, has become an essential skill for professionals across industries—from marketing and finance to healthcare and IT.
As we look ahead to 2025, new tools, technologies, and mindsets are transforming how we visualize data. Whether you’re just starting out or already working with tools like Power BI, Tableau, or Python-based libraries, staying ahead of these trends is key to remaining relevant and competitive in the digital workforce.
At Generiss Academy, we offer industry-aligned training in data analysis and visualization, helping learners of all backgrounds build the technical and creative skills needed to communicate insights effectively. So, what does the future hold for data visualization? Let’s dive in.
1. AI-Driven Visualizations Are on the Rise
Artificial Intelligence is no longer limited to sci-fi movies or chatbots. In 2025, AI is becoming an integral part of data visualization tools. Platforms like Power BI and Tableau are now embedding AI-powered features such as natural language queries, anomaly detection, and predictive analytics.
This means users can simply ask questions like, “Why did sales drop in Q2?” and receive smart, auto-generated visuals that provide the answers. AI will streamline the process of transforming raw data into actionable insights, allowing professionals to spend less time formatting and more time decision-making.
At Generiss Academy, our courses integrate these evolving capabilities, ensuring our learners don’t just understand today’s tools, but are also prepared for the AI-enhanced platforms of tomorrow.
2. Interactive Dashboards Will Replace Static Reports
Static charts and slide decks are becoming relics of the past. In 2025, organizations increasingly demand real-time, interactive dashboards that allow stakeholders to explore data themselves.
Tools like Tableau, Power BI, and web-based frameworks such as Plotly Dash and Streamlit offer ways to create interactive experiences. Users can filter, sort, zoom, and drill down into data without needing to code or request custom reports.
This self-service model empowers teams and executives alike, promoting a culture of data-driven decision-making. Generiss Academy prepares learners with hands-on projects in interactive dashboard creation, making them job-ready from day one.
3. Data Storytelling Will Be a Critical Skill
Numbers alone don’t persuade—stories do. In 2025, the most effective data professionals will be those who can weave compelling narratives with their data. This involves not just designing attractive visuals, but also choosing the right charts, sequencing insights, and tailoring the message to the audience.
At Generiss Academy, we emphasize this in our training programs. Our learners don’t just build charts—they learn to communicate insights that influence decisions and create impact.
4. Cross-Platform Compatibility Is Now Essential
In a hybrid and remote-first world, visualizations must be accessible across devices—from desktop monitors to smartphones. As mobile-first decision-making increases, dashboards must be optimized for responsive design and fast load times.
The future belongs to tools that support seamless integration with cloud platforms, CRMs, and collaborative tools like Microsoft Teams, Slack, and SharePoint. Knowing how to build for cross-platform performance is becoming a must-have skill.
5. Open-Source Visualization Tools Are Gaining Ground
While commercial tools like Tableau and Power BI remain dominant, open-source tools such as Python’s Matplotlib, Seaborn, Plotly, and R’s ggplot2 are seeing a resurgence, especially among data scientists and engineers.
In 2025, the ability to customize, automate, and extend visualizations through code will set candidates apart in the job market. Generiss Academy includes training in both code-based and GUI-based tools, giving students a competitive edge regardless of their career path.
Prepare for the Future with Generiss Academy
The world of data visualization is evolving quickly—and those who adapt will be in high demand. Whether you’re aiming to become a data analyst, business intelligence specialist, or data-driven project manager, understanding the future of data visualization gives you a head start.
At Generiss Academy, we offer a range of IT and data-focused programs that are designed with the future in mind. From Python for data science to Power BI and Tableau for dashboards, we equip our learners with the tools and confidence they need to excel.
We also offer flexible learning options, scholarships, and career support to help learners transition into rewarding tech careers.
Ready to future-proof your skills?
Join us at https://www.generiss.academy and start building a career where you don’t just read the data—you bring it to life.


